
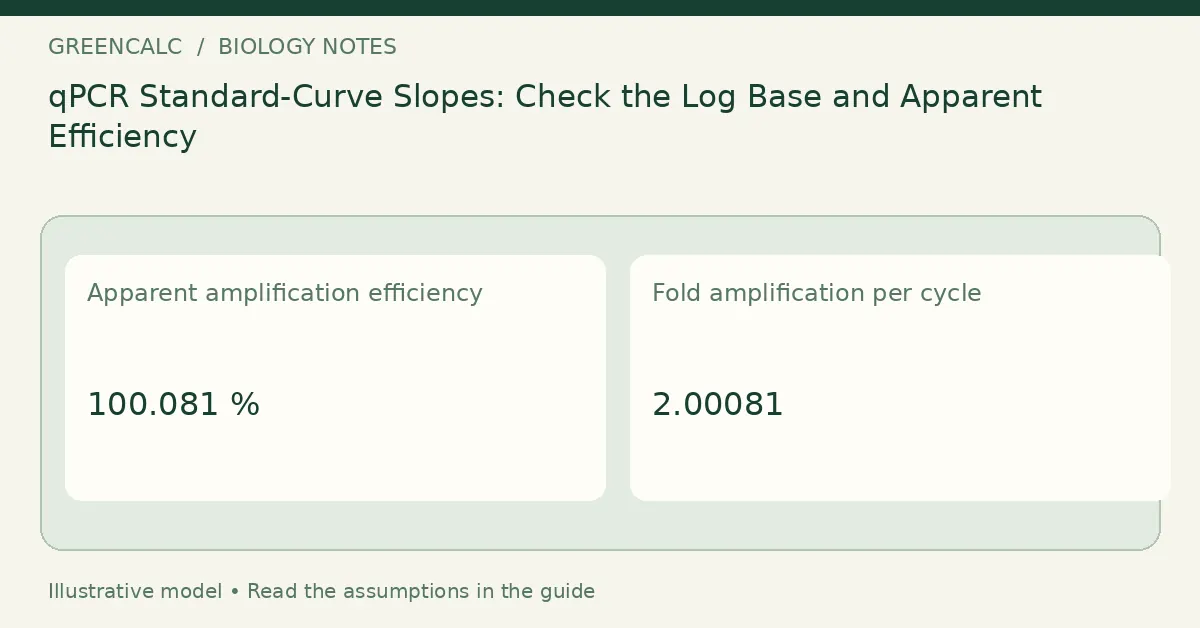
Original instructional diagram for qPCR Standard-Curve Slopes: Check the Log Base and Apparent Efficiency. Values, when shown, are illustrative; clinical images do not recommend a dose.
Check how the horizontal axis was built
The standard-curve equation here expects the logarithm base ten of starting quantity. A slope fitted against natural logarithms has a different numerical meaning. Confirm the axis definition before comparing efficiencies from different software exports.
Use qPCR Efficiency Calculator to work through these inputs while keeping the displayed assumptions in view.
Apparent efficiency can expose a measurement problem
An estimate above one hundred percent is not silently capped at one hundred. It can signal issues requiring review rather than a better-than-ideal reaction. Curve quality, measurement range and assay-specific validation need separate assessment; one computed efficiency is not a complete quality certificate.
This question belongs to the Genetics calculators group within Biology calculators.
Read the calculation on its stated basis
Amplification factor = 10^(−1/slope); percent efficiency = (factor − 1) × 100.
Retain the input definitions and units with the result. A later comparison should use the same basis; a change in method is a new scenario, not simply a more precise version of the old number.
Keep related questions separate
Annealing Temperature Calculator addresses a related part of the measurement or interpretation task. Check its own method before carrying a value from one tool to the other.
For a related perspective, read Primer Tm and Annealing Temperature: Keep the Assay Conditions Together.
For tools in other subjects, return to GreenCalc. Keep the calculator result with its assumptions rather than using a link or a matching unit as evidence that two models are interchangeable.
By GreenCalc · Updated 2026-11-05