
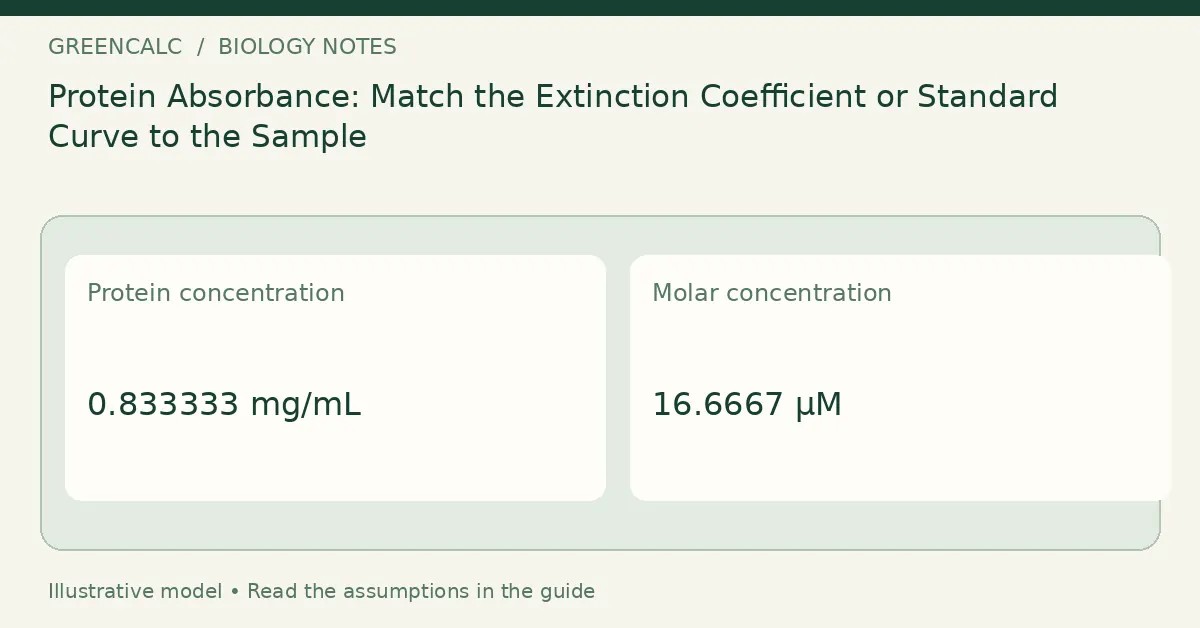
Original instructional diagram for Protein Absorbance: Match the Extinction Coefficient or Standard Curve to the Sample. Values, when shown, are illustrative; clinical images do not recommend a dose.
Choose a compatible coefficient or curve
A molar extinction coefficient must correspond to the protein and wavelength in use. A standard-curve slope must correspond to the actual assay and concentration units. They are alternative input models, not interchangeable constants to choose by whichever result looks expected.
Use Protein Concentration Calculator to work through these inputs while keeping the displayed assumptions in view.
Check the blank and measurement range
A value outside a validated response range should not be rescued by reporting more decimal places. Keep blank correction, path normalization and sample dilution explicit. A concentration estimate alone cannot show that the sample is pure protein or free from interfering substances.
This question belongs to the Bio laboratory calculators group within Biology calculators.
Read the calculation on its stated basis
Beer–Lambert: molarity = A/(εl). Multiply molarity by molecular weight to obtain mg/mL numerically. Calibration: concentration = (A − intercept)/slope.
Retain the input definitions and units with the result. A later comparison should use the same basis; a change in method is a new scenario, not simply a more precise version of the old number.
Keep related questions separate
DNA Concentration Calculator addresses a related part of the measurement or interpretation task. Check its own method before carrying a value from one tool to the other.
For a related perspective, read A260 Measurements: Avoid Applying Dilution or Path Correction Twice.
For tools in other subjects, return to GreenCalc. Keep the calculator result with its assumptions rather than using a link or a matching unit as evidence that two models are interchangeable.
By GreenCalc · Updated 2026-11-05