
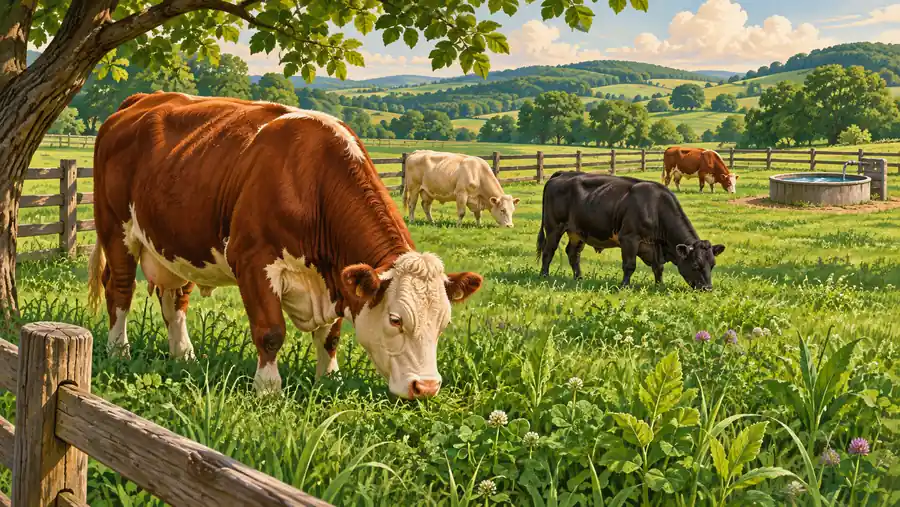
Original editorial illustration for Connect Forage Budgets, Stocking Scenarios and Livestock Records
Start with a time-matched forage budget
An acreage number alone does not say how many animals a pasture can support. A scenario needs forage production on a stated dry-matter and time basis, an available share, an animal-demand basis and a grazing duration. Those assumptions should be locally justified. The calculator does not observe the pasture or prescribe a management plan.
Keep performance records on their own denominators
Mortality risk, animal-time mortality density and feed conversion are different quantities. They may all inform a record system, but they cannot be compared as though a smaller number always means the same improvement. Record population changes, reporting periods and feed definitions before calculating a ratio.
Do not hide management decisions inside rounding
A forage-limited head estimate is a conditional result. Rounding it down creates a whole-number scenario, not a recommendation guaranteed by weather, access or animal health. Similarly, an expenditure estimate can organize a fence plan without checking whether the design suits the livestock or the site. Quantities support decisions but do not supply all of their evidence.
Start in Biology calculators for the field and measurement tools. This workflow also distinguishes questions handled in Finance calculators. Follow the quantity and its definition rather than assuming that a shared unit makes different models interchangeable.
Worked case 1: Cattle per Acre Calculator
The example matches an entered forage supply to an entered demand over one planning period. The usable percentage is not assumed to be all production, and the animal intake is a supplied scenario value. Neither figure is offered as a recommendation for another pasture.
Calculate this scenario with Cattle per Acre Calculator using the following stated inputs.
| Input definition | Illustrative value |
|---|---|
| Actually grazable area (acres) | 20 |
| Forage dry matter over the planning period (lb/acre) | 2000 |
| Planned usable share of forage (%) | 40 |
| Average live weight per head (lb) | 1000 |
| Plan’s daily dry-matter intake (% of live weight) | 2.5 |
| Grazing days in this forage budget | 60 |
| Calculated quantity | Result | Unit |
|---|---|---|
| Forage-limited head estimate | 10.6667 | head |
| Whole head rounded down | 10 | head |
| Head per acre under this scenario | 0.533333 | |
| Usable dry matter | 16000 | lb |
The whole-head result is constrained by this forage budget only. Water access, quality, regrowth, losses and changing animal needs remain outside the equation. Keep the unrounded estimate so a later revision can distinguish mathematical rounding from a changed assumption.
The Forage-demand and availability definitions separates forage availability and animal demand. Use inputs justified for the actual planning period rather than copying these illustrative values.
Worked case 2: Cattle per Acre Calculator
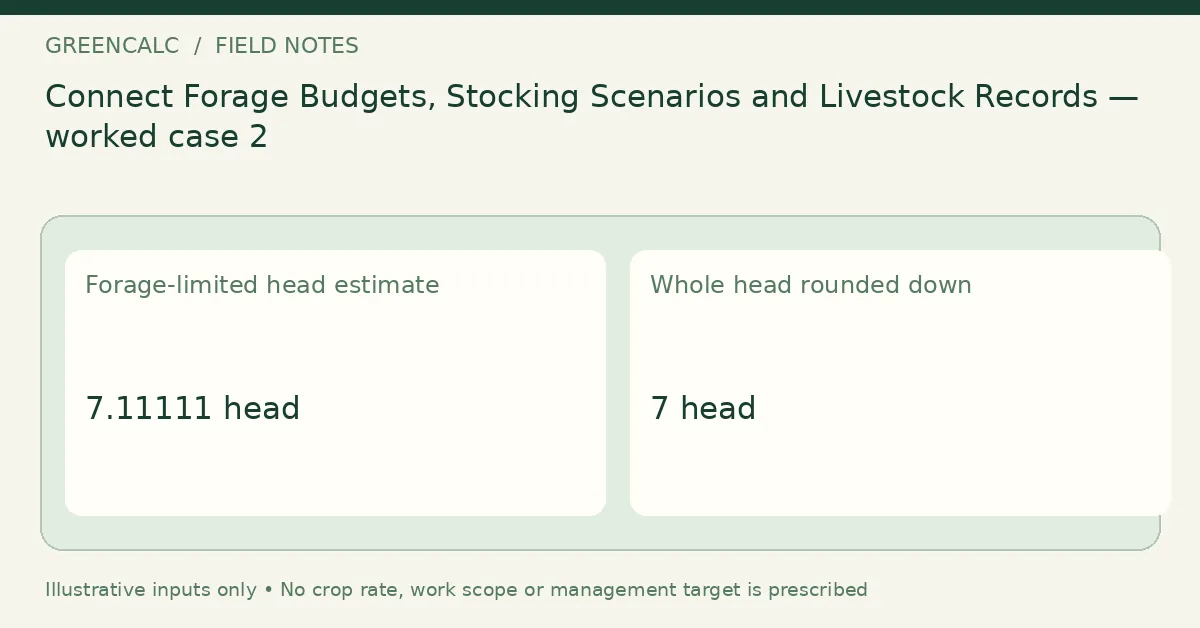
Extending the grazing duration while holding the entered forage supply constant increases demand per head over the period. This isolates the time-basis assumption rather than claiming that the pasture has changed. A seasonal supply should not be spent twice in overlapping scenarios.
Calculate this scenario with Cattle per Acre Calculator using the following stated inputs.
| Input definition | Illustrative value |
|---|---|
| Actually grazable area (acres) | 20 |
| Forage dry matter over the planning period (lb/acre) | 2000 |
| Planned usable share of forage (%) | 40 |
| Average live weight per head (lb) | 1000 |
| Plan’s daily dry-matter intake (% of live weight) | 2.5 |
| Grazing days in this forage budget | 90 |
| Calculated quantity | Result | Unit |
|---|---|---|
| Forage-limited head estimate | 7.11111 | head |
| Whole head rounded down | 7 | head |
| Head per acre under this scenario | 0.355556 | |
| Usable dry matter | 16000 | lb |
A longer horizon may also change real forage growth and losses, which this controlled comparison deliberately holds fixed. It is a sensitivity check, not a forecast. Revise the forage model separately when the actual planning period changes.
The Stocking scenarios and their assumptions discusses the assumptions behind stocking scenarios. A local forage budget remains distinct from a universal head-per-acre rule.
Worked case 3: Animal Mortality Rate Calculator
A closed-cohort risk uses animals at risk at the start of a defined observation period. The displayed percentage belongs to that cohort and period. Births, transfers or incomplete follow-up can make the simple denominator unsuitable for an actual open herd.
Calculate this scenario with Animal Mortality Rate Calculator using the following stated inputs.
| Input definition | Illustrative value |
|---|---|
| Observation basis | cohort |
| Deaths during the stated observation period | 2 |
| Animals at risk at start of closed cohort | 100 |
| Calculated quantity | Result | Unit |
|---|---|---|
| Closed-cohort mortality risk | 2 | % |
The result does not diagnose a cause or automatically become an annual risk. State the period and population definition before comparing another group. A count-based summary should not replace veterinary investigation of concerning losses.
Worked case 4: Animal Mortality Rate Calculator
An animal-time example uses accumulated exposure rather than the initial head count. It reports deaths per a defined number of animal-days. This is a different denominator and output unit from a closed-cohort percentage, even if the reported death count is the same.
Calculate this scenario with Animal Mortality Rate Calculator using the following stated inputs.
| Input definition | Illustrative value |
|---|---|
| Observation basis | animaldays |
| Deaths during the stated observation period | 2 |
| Total observed animal-days | 3000 |
| Calculated quantity | Result | Unit |
|---|---|---|
| Mortality incidence density | 0.666667 | deaths per 1,000 animal-days |
Keep the way animal-days were accumulated with the record. The rate does not identify an individual probability without additional assumptions. Do not compare it directly with a percentage merely because both outputs summarize deaths.
Worked case 5: Feed Conversion Ratio Calculator
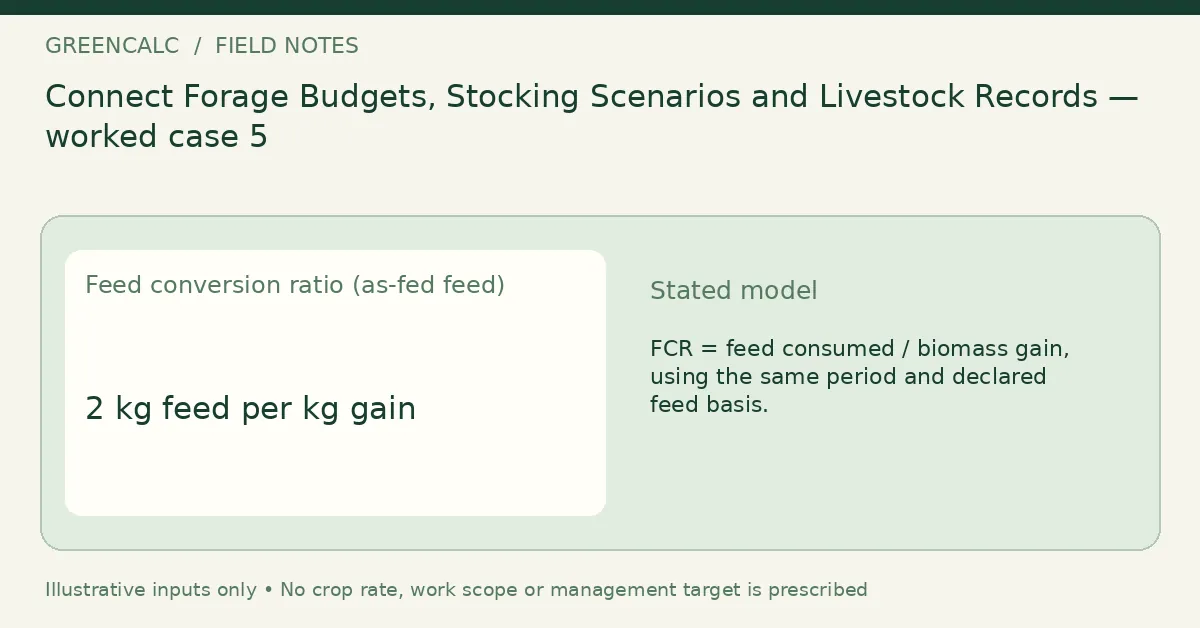
The feed-conversion example needs a feed-consumption total and a biomass-gain quantity on a matched reporting basis. Feed delivered is not automatically feed consumed. The feed’s as-fed or dry-matter definition also belongs beside the ratio.
Calculate this scenario with Feed Conversion Ratio Calculator using the following stated inputs.
| Input definition | Illustrative value |
|---|---|
| Feed actually consumed during period (kg) | 200 |
| Biomass gain on the declared reporting basis (kg) | 100 |
| Basis of the feed mass | asfed |
| Calculated quantity | Result | Unit |
|---|---|---|
| Feed conversion ratio (as-fed feed) | 2 | kg feed per kg gain |
A lower calculated ratio is not by itself evidence of health, a balanced diet or a universally better production system. Mortality, removals and inventory changes need the appropriate accounting convention before the biomass denominator can be interpreted.
For the moisture-basis distinction behind feed comparisons, read Wet and Dry Pet Food Comparisons: Put the Nutrient on the Same Moisture Basis. The pet-food examples in that guide explain a unit basis; their feeding context is not a livestock performance standard.
Worked case 6: Livestock Fence Cost Calculator
A fence budget connects the pasture plan to a listed work scope. This example excludes gateway lengths from the fence run and accounts for listed fixed costs separately. The material allowance is applied only to the material portion, not automatically to every budget line.
Calculate this scenario with Livestock Fence Cost Calculator using the following stated inputs.
| Input definition | Illustrative value |
|---|---|
| Total boundary / fence alignment (m) | 400 |
| Total gateway openings excluded from fence run (m) | 12 |
| All-strand material cost per fence-run meter | 5 |
| Installation cost per fence-run meter | 3 |
| Material budget allowance (%) | 10 |
| Total gate, end-post and other listed fixed costs | 1000 |
| Currency label (no exchange-rate conversion) | USD |
| Calculated quantity | Result | Unit |
|---|---|---|
| Fence run excluding openings | 388 | m |
| Material budget | 2134 | USD |
| Labor budget | 1164 | USD |
| Total entered-cost estimate | 4298 | USD |
The result cannot validate the fence design for a species or supply a contractor quote. Terrain, product choice and unlisted work can matter. Record what the unit rates already include so a separate gate or post allowance does not duplicate the same cost.
Reconcile the forage budget before rounding animal numbers
The first stocking scenario starts with twenty acres, two thousand pounds of forage dry matter per acre over the stated period, and a usable share of forty percent. The entered usable supply is therefore sixteen thousand pounds. At one thousand pounds live weight and an entered daily intake fraction of two-point-five percent, the scenario demand is twenty-five pounds of dry matter per head per day.
For sixty days, that becomes fifteen hundred pounds per head and an unrounded estimate of about ten-point-six-seven head. For ninety days, the same fixed supply is divided by twenty-two hundred fifty pounds per head, giving about seven-point-one-one head. Rounding to ten or seven whole head leaves different unallocated amounts in this model. It does not demonstrate how much forage will actually remain on the site.
The calculation deliberately holds production and usable share fixed while changing duration. Real production, quality, access and losses may also change over a longer period. A locally justified plan needs to address those conditions separately. Do not interpret an arithmetic remainder as permission to remove additional forage or disregard a monitoring plan. The value is a budget balance under the inputs, not a measurement of pasture condition or a complete statement of animal requirements.
Check the record before using it elsewhere
Use the following questions to audit this particular workflow. An unanswered question is an input or interpretation issue; it should not be hidden by rounding the output or choosing a result that resembles the expected answer.
- Does forage production refer to the grazing period being budgeted?
- Is the usable share documented as an assumption rather than a measurement?
- Are animal weight and intake units compatible?
- Has a seasonal supply been counted more than once?
- Is mortality expressed as cohort risk or exposure density?
- Are feed and biomass records from the same interval?
- What costs are already included in the fence unit rate?
- Which conditions need local agronomic or veterinary assessment?
Retain a revisable measurement sheet
Keep the original observations, the date and the input definitions alongside the calculated result. When a plan changes, record the new scenario separately instead of replacing the evidence behind an earlier estimate. A measured change, a revised assumption and a unit conversion are different events in the record.
Use Cattle per Acre Calculator for the main quantity in this workflow. For other subjects, return to GreenCalc; for a related calculation, begin with its own units, basis and limitations rather than transferring a result by name alone.
By GreenCalc · Updated 2026-11-06