
DBH Records: Consistent Height and Stem Rules Matter in Stand Comparisons; illustrative quantitative diagram
Make a controlled comparison
Record the measurement height and the treatment of irregular or multiple stems. A method change can shift the result without a real change in the stand. The expansion assumes an appropriate sample and does not automatically estimate biomass, timber value or a thinning requirement.
Basal Area Calculator makes the stated relationship reproducible. It cannot supply missing product information, identify a representative sample or establish a suitable site-specific management decision.
Change one input at a time
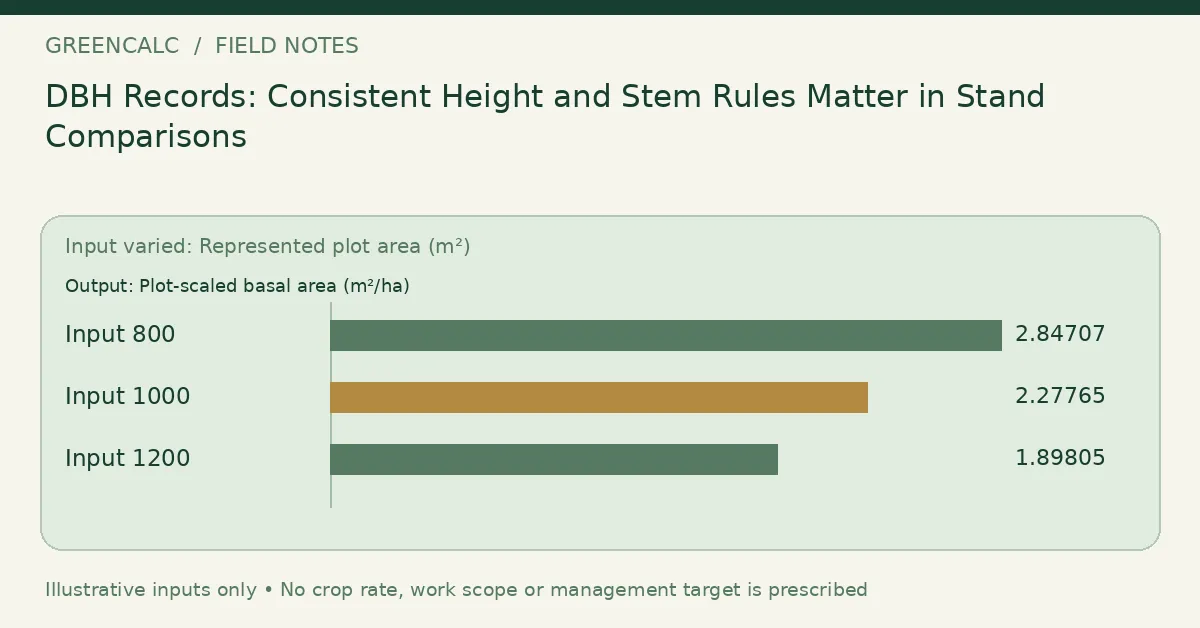
The table varies Represented plot area (m²) around the illustrative starting value while retaining the other assumptions. These are sensitivity scenarios, not a measured range or recommended settings.
| Represented plot area (m²) | Selected calculated output | Unit |
|---|---|---|
| 800 | 2.84707 | m²/ha |
| 1000 | 2.27765 | m²/ha |
| 1200 | 1.89805 | m²/ha |
Browse Biology calculators and its Trees & Forestry Calculators section when another measurement is needed. A related tool may use a different denominator or physical basis.
Keep the interpretation within scope
Keep Represented plot area (m²) with the selected output in the comparison record. The three alternatives do not identify which input applies to a particular site or product. A justified new observation should be recorded as new evidence, rather than choosing an input merely because its result looks convenient.
A related quantity
Tree Diameter Calculator addresses a related part of the task. Check its own input definition before carrying a number across.
Continue with Basal Area from a Plot: Sum Cross-Sections Before Expanding to a Hectare for the other part of this measurement question.
Return to GreenCalc for other subjects. Keep raw observations, chosen assumptions and calculated quantities identifiable so a later revision does not overwrite the basis of the original record.
By GreenCalc · Updated 2026-11-06