
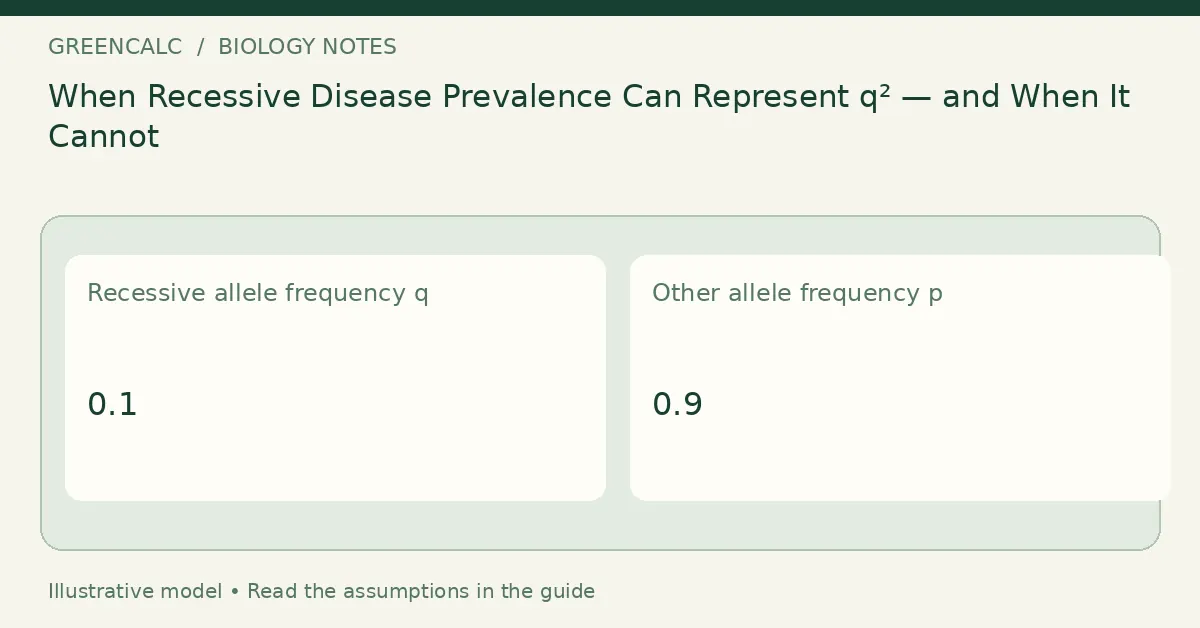
Original instructional diagram for When Recessive Disease Prevalence Can Represent q² — and When It Cannot. Values, when shown, are illustrative; clinical images do not recommend a dose.
State the inheritance model before using prevalence
The square-root relationship assumes a particular autosomal-recessive model and population conditions. Incomplete penetrance, ascertainment, multiple alleles or a different inheritance pattern can break the connection between an observed disease prevalence and the expected recessive genotype frequency.
Use Allele Frequency Calculator to work through these inputs while keeping the displayed assumptions in view.
Do not interpret it as an individual test
A population-level conditional estimate is not a carrier test or a family-specific risk assessment. A precise calculated percentage cannot replace clinical genetics. Retain the population definition and the source of the prevalence estimate alongside the arithmetic.
This question belongs to the Genetics calculators group within Biology calculators.
Read the calculation on its stated basis
Under the stated autosomal-recessive Hardy–Weinberg model: q = √prevalence, p = 1 − q, expected heterozygotes = 2pq.
A model is useful only within its assumptions. The result describes the input population or cross; it does not supply missing biological information or replace an appropriate genetic assessment.
Keep related questions separate
Hardy-Weinberg Equilibrium Calculator addresses a related part of the measurement or interpretation task. Check its own method before carrying a value from one tool to the other.
For a related perspective, read Observed Genotypes and Expected Counts: Reading a Hardy–Weinberg Comparison.
For tools in other subjects, return to GreenCalc. Keep the calculator result with its assumptions rather than using a link or a matching unit as evidence that two models are interchangeable.
By GreenCalc · Updated 2026-11-05