
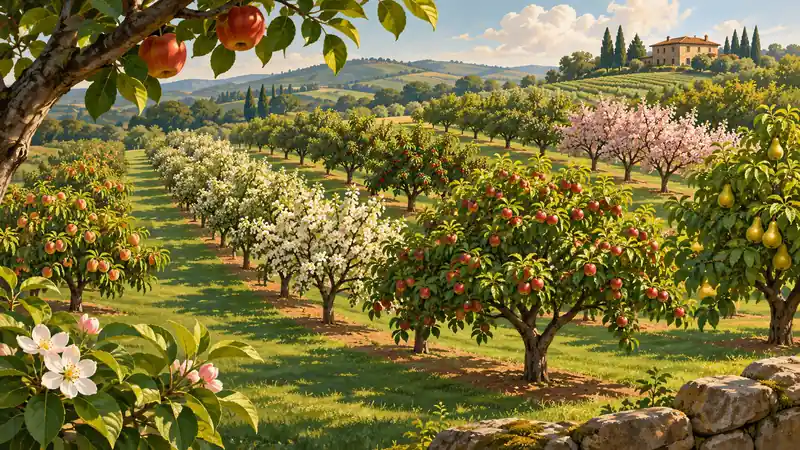
Original editorial illustration for Read Orchard and Stand Structure with Spacing, Basal Area and Leaf Area
Name the area represented by each number
A planting plan, a sample plot and a single crown projection can all use area, but they refer to different spaces. Keep the reference area with every density or index. Otherwise a result from one tree can be accidentally compared with a hectare total, or an observed stand can be mistaken for an intended layout.
Do not substitute one structural measure for another
Tree count describes individuals, basal area describes stem cross-section and leaf area describes foliage under a stated model. Two stands can have the same count and different basal areas. A canopy index does not automatically establish the trunk sizes or an appropriate planting distance. The examples illustrate separate measurements rather than a universal orchard prescription.
Retain sampling and seasonal context
Field observations belong to a date and a method. A sample needs an appropriate selection basis, and a leaf-area assumption can change with season and canopy condition. Arithmetic can expand or combine observations, but it does not determine the suitability of the sample, choose a thinning requirement or predict the response to a management change.
Start in Biology calculators for the field and measurement tools. This workflow also distinguishes questions handled in Statistics calculators, Ecology calculators. Follow the quantity and its definition rather than assuming that a shared unit makes different models interchangeable.
Worked case 1: Tree Spacing Calculator
The layout scenario deliberately uses different between-row and within-row distances. It estimates positions over the plantable area rather than checking access, rootstock, crown growth or a species requirement. Excluded headlands and roads should already be outside the area entered.
Calculate this scenario with Tree Spacing Calculator using the following stated inputs.
| Input definition | Illustrative value |
|---|---|
| Plantable area excluding paths (m²) | 10000 |
| Between-row spacing (m) | 5 |
| Within-row spacing (m) | 4 |
| Calculated quantity | Result | Unit |
|---|---|---|
| Area-based planting estimate | 500 | positions |
| Theoretical density | 0.05 | positions/m² |
The density is theoretical and does not draw the boundary layout. A plan needs a site-specific assessment before the count becomes a planting instruction. Keep later survival and establishment observations separate from this intended-position number.
Worked case 2: Plant Population Calculator
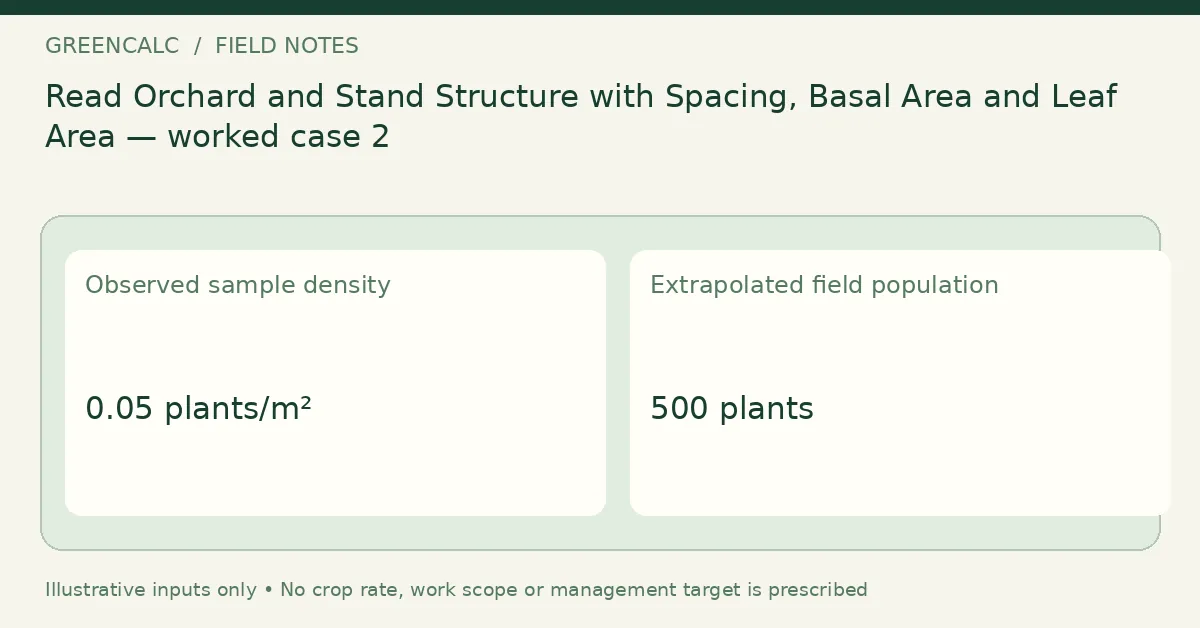
An observed count over a represented plot provides a different basis from a spacing plan. The calculation expands the sample density to the larger area. Its agreement with a planned number, if any, does not itself prove the sample is representative.
Calculate this scenario with Plant Population Calculator using the following stated inputs.
| Input definition | Illustrative value |
|---|---|
| Established plants counted in sample | 5 |
| Represented sample area (m²) | 100 |
| Field area being extrapolated (m²) | 10000 |
| Calculated quantity | Result | Unit |
|---|---|---|
| Observed sample density | 0.05 | plants/m² |
| Extrapolated field population | 500 | plants |
| Equivalent density per hectare | 500 | plants/ha |
Record plot locations and counting rules before comparing the result with another date. A change can reflect recruitment, removals, losses or a changed method. The expansion does not identify the explanation or calculate a confidence interval automatically.
The Stand-measurement definitions provides a stand-measurement framework. Its sampling context matters as much as the arithmetic used to expand a plot.
Worked case 3: Basal Area Calculator
Stem-size information adds something that count alone cannot supply. Each diameter contributes an area proportional to its square. Summing those areas and expanding by plot size produces a stand-style cross-sectional measure under the sampling assumptions.
Calculate this scenario with Basal Area Calculator using the following stated inputs.
| Input definition | Illustrative value |
|---|---|
| Recorded trunk diameters (cm), separated by commas | 20,30,40 |
| Represented plot area (m²) | 1000 |
| Calculated quantity | Result | Unit |
|---|---|---|
| Sum of measured trunk basal areas | 0.227765 | m² |
| Plot-scaled basal area | 2.27765 | m²/ha |
Do not relabel the result as crown cover or biomass. A few larger stems can change basal area without a proportional change in tree count. Keep raw diameters so a later analysis can reproduce the distribution rather than relying only on a total.
For the distinction between measured tree quantities, see Sampling and forestry measurement context. Counts, diameters and structural indices should not silently replace one another.
Worked case 4: Tree Diameter Calculator
The circumference example provides a check on the circular-equivalent diameter used in a cross-sectional calculation. Consistent measurement height and units are essential. An irregular stem or a changed bark convention can alter comparability even when both calculations use the same equation.
Calculate this scenario with Tree Diameter Calculator using the following stated inputs.
| Input definition | Illustrative value |
|---|---|
| Circumference at the recorded measurement height (cm) | 125.664 |
| Calculated quantity | Result | Unit |
|---|---|---|
| Circular-equivalent diameter | 40 | cm |
This is a conversion of a measurement, not an independent observation of growth. Preserve the original circumference and its method. A later difference should not be interpreted until the recording conventions are confirmed to match.
Worked case 5: Tree Leaves Calculator
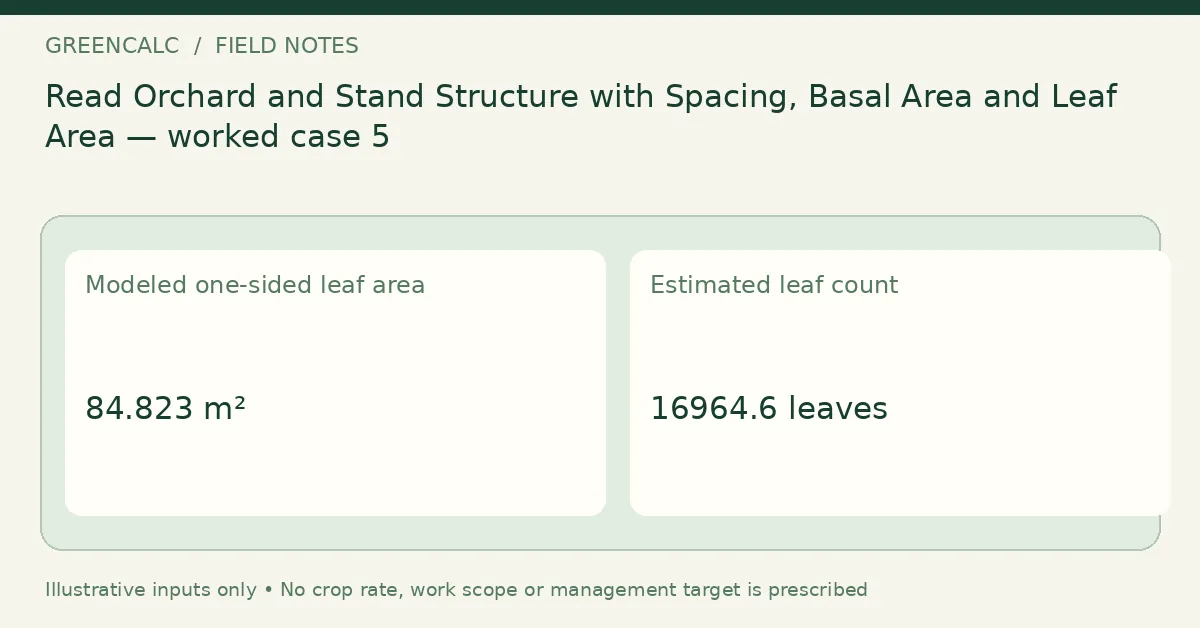
A single-crown scenario uses an index defined on that crown’s projection area. It does not borrow a stand-level index without checking the reference area. The estimated leaf count also depends on the entered mean one-sided leaf size.
Calculate this scenario with Tree Leaves Calculator using the following stated inputs.
| Input definition | Illustrative value |
|---|---|
| Projected crown radius (m) | 3 |
| One-sided leaf area index on that crown-area basis | 3 |
| Measured / assumed mean one-sided leaf area (cm²) | 50 |
| Calculated quantity | Result | Unit |
|---|---|---|
| Modeled one-sided leaf area | 84.823 | m² |
| Estimated leaf count | 16964.6 | leaves |
The model does not count leaves directly or infer an appropriate pruning action. Changes in either index or mean leaf area alter the result. State whether those values are measurements, references or hypothetical assumptions before discussing an apparent difference.
Worked case 6: Tree Leaves Calculator
This controlled comparison changes only the assumed index while leaving crown radius and mean leaf size unchanged. The proportional result demonstrates how much of the count comes from that particular input. It does not establish an observed seasonal loss.
Calculate this scenario with Tree Leaves Calculator using the following stated inputs.
| Input definition | Illustrative value |
|---|---|
| Projected crown radius (m) | 3 |
| One-sided leaf area index on that crown-area basis | 2 |
| Measured / assumed mean one-sided leaf area (cm²) | 50 |
| Calculated quantity | Result | Unit |
|---|---|---|
| Modeled one-sided leaf area | 56.5487 | m² |
| Estimated leaf count | 11309.7 | leaves |
A real seasonal comparison would need compatible measurements and a reason to apply the same model at both times. The scenario should therefore be labeled as a sensitivity example, not as evidence of decline, health or carbon-storage change.
Compare structural quantities without substituting one for another
Two trunks of twenty centimeters diameter have a combined circular-equivalent basal area of about zero-point-zero-six-two-eight square meters. One trunk of forty centimeters diameter has about zero-point-one-two-five-seven square meters. The single larger trunk therefore has twice the modeled basal area of those two smaller trunks, despite representing half as many individual trees.
If those measurements came from the same represented plot area, their per-hectare expansions would preserve that relationship. This does not show which stand is preferable. It illustrates why tree count alone cannot replace a size distribution or a cross-sectional measure. The observed stem rules and plot selection still need to be appropriate before either expansion represents the larger stand.
Leaf area adds another distinct basis. At an entered crown radius of three meters and a leaf area index of three, the modeled one-sided foliage area is about eighty-four-point-eight square meters. An index of two gives about fifty-six-point-five square meters under the same crown assumption. Dividing either by a mean leaf size creates another conditional estimate. None of these calculations directly measures canopy health, timber volume or carbon storage, and changing a model input is not evidence that an actual tree lost that amount of foliage.
Check the record before using it elsewhere
Use the following questions to audit this particular workflow. An unanswered question is an input or interpretation issue; it should not be hidden by rounding the output or choosing a result that resembles the expected answer.
- Does the number refer to a site, plot or individual crown?
- Are planned positions separate from observed trees?
- Do raw diameters remain available after summing basal area?
- Is measurement height consistent across records?
- Does the leaf index use the intended projection area?
- Are seasonal assumptions stated rather than implied?
- Would a larger sample change the interpretation?
- Which management decision needs evidence outside these structural calculations?
Retain a revisable measurement sheet
Keep the original observations, the date and the input definitions alongside the calculated result. When a plan changes, record the new scenario separately instead of replacing the evidence behind an earlier estimate. A measured change, a revised assumption and a unit conversion are different events in the record.
Use Tree Spacing Calculator for the main quantity in this workflow. For other subjects, return to GreenCalc; for a related calculation, begin with its own units, basis and limitations rather than transferring a result by name alone.
By GreenCalc · Updated 2026-11-06